Table of Contents
ToggleTracking, Gathering, analyzing, and evaluating the website data wasn’t an easy job. Initially, if the website owners wanted to know their site’s traffic, they had to read their server log.
Now, the server would simply present the list of every action and information on the site, which was hard to comprehend. And there is when analytical tools came for help. Hence, when we talk about data analytical tools, Google Analytics is a service that tops the list for many reasons.
If you hold a company online, then there is high chance that the term probably knows you. However, if you are a part of that unfortunate pool of people, who do not know much about it, then look no further, as we have got you covered.
In this article, you will find an ultimate and complete kind about google analytics for beginners. This guide contains all of the information a person must know about google analytics. We have tried our best to explain each Google Analytics attribution, including the entire account creation process under it. So without wasting any further time, let us directly walk through the article.
An ultimate guide about google analytics for beginners
Matter of content:
- What is google analytics
- How does google analytics work?
- Google Analytics report generation?
- How to log in and operate your google analytics account
- Google Analytics attributions
- Final words
What is googol analytics?
Google Analytics is an online web analytic tool launched by Google in 2005 to track and report web traffic. As of 2019, it is the most used analytical tool in the online business world.
In addition, google analytics grants and SDK enable the user to gather usage data from both sorts of devices, i.e., android and IOS (Apple devices). This tool Is known as Google Analytics for mobile apps. However, the user can block the tool from browsers, firewalls, browser extensions, etc.
Historical overview
The tool has undergown various versions since its inception. Also, we use today’s current version in its 4th iteration, called GA4 ( a short form of Google Analytics 4th version). GA4 is nothing else but a renamed version of Google’s property released in beta form in 2019.
One significant feature of the latest tool is its natural integration with Google’s BigQuery. This feature was previously available only with the GA 360 enterprise.
How does google analytics work?
Google Analytics works by acquiring user data from the website through page tags. If you want to track or gather data from your website to google analytics, you must first place a tag over it.
As soon as the page tag is accurately placed, Google Analytics will start to collect data. Moreover, after the data is fully contained, the tool puts it into the reports that are made up of dimensions and metrics. But wait, what are metrics and dimensions? Look below to find the answer.
- Metrics: Metrics is the source to produce numbers that you will find on the platform. Hence, anything that one can measure with a number can be called out a metric. For instance, you may think of the number of users, the number of items sold, the value of conversions, hours spent on a single task, or the number of employees you have.
- Dimension: a dimension is a way how metrics can be segmented. For instance, think of a number BY, i.e., the number of users BY the resources.
How to google analytics generates reports?

As we have already discussed, google analytics gathers data with page tags, So when a javascript page tag is inserted in the page’s code, it starts to run in the web browser. Thus, it starts to collect and send the data to Google’s data collection server, which is then used in the report generation.
How to log in and operate your google analytics account
Here we are listing the step-by-step procedure for creating and managing your very first google analytics account. Have a look
Creating an account
- Open a google analytics website
The first step is navigating to the Google Analytics website. For the regards, go to ” google.com/analytics” and click on “Start for free.”
On the next screen, provide your correct email address and click on the “Next” button to continue.
- Set password: Now, the next thing is setting up a password for your newly maid Google Analytics account. We always suggest choosing a solid password that encompasses upper and lower case letters along with 3 numbers. Also, having strong passwords aids a lot in maximizing your account’s security.
- Sign in: When you are done with all of the above steps, sign in to the account. And congratulations, you have just logged in to your Google Analytics account.
Set up the account:
When you create a google analytics account, you are provided with a unique tracking id along with a global site tag. The tag includes the Tracking ID for that particular property. Follow the set of instructions listed below to find the Tracking ID.
- Sign in to your google analytics account
- Click “Admin.”
- Access the ‘ACCOUNT’ column and select an account from the menu.
- Select a property from the ‘PROPERTY” column
- Under ‘PROPERTY,’ click on Tracking Info> Tracking Code.
Now, you will find your tracking id displayed at the top of the page. Moreover, the global site tag can be found down the page in a text box under the Website Tracking> Global Site Tag.
So, once you have acquired the tracking code, there are various ways to add it to your website. For instance, you can copy and paste into the header and footer HTML of your website. Or you can install a plugin such as Yoast SEO, which does the job of the heavy lifting for you.
Operating the account
Now that you are done with creating the account, it’s time we teach you to operate it. Here are a few factors you should take into consideration to efficiently manage the account:
Dashboard overview
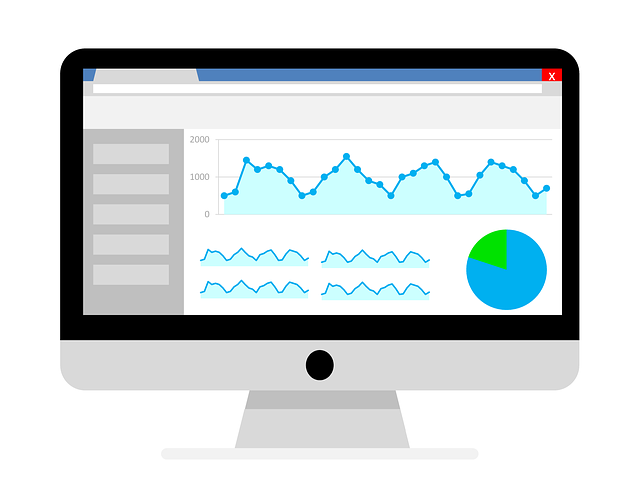
A quick overview is presented in front of you about your website when you first log in to your google analytics account. It is a form of a report that represents data from a specific span. You can adjust the period from the top-right corner of the screen at any time you want.
The dashboard shows:
- Users
- Sessions
- Bounce rates
- Session duration
- Active users
- Acquisition resources
- And more
Real-time
In the left column, you will see the real-time. Click on it to learn more about the users on your website at that moment. You can see
- Location
- Traffic source
- Web pages they have visited.
Businesses use this section for various reasons, such as:
- Campaign testing
- Tracking Code Verification
- Media and Events Monitoring
Audience
An audience tab exists to let you know about your website’s visitors. Also, it grants an inside look at the users who visited your website within a definite span. Hence, you will see the information regarding the below-listed factors under the AUDIENCE tab.
- Geographic Location
- Browser/ Device/ Operating System/ Service Provider Used.
- Age
- Gender
- Interests
- Language
- Engagement Behavior
- And more
Google analytics attributions
The main aim of Google analytic attributions is to let business employees, especially marketers, understand how to distinguish channels that contribute to the customer journey. There are 4 primary sorts of Google Analytics available for this purpose. Have a look at them
Conversion paths:
The conversion path reports aid you in determining the customer’s path to conversion. It also elaborates on how different attribution models distribute credit on those paths.
Conversion lag:
The conversion lag lets you have overlooked the length of your online sales cycle. Also, you get to understand the distribution of days to conversion across the converting paths.
Conversion path lag:
As explained by its name, the conversion path lags enable you to determine the total number of clicks it takes for users to convert it into the lead
Model comparison:
Last but definitely not least, Model Comparison is next on the list. Its significant purpose of existing is to let you select and compare a distinguished variety of attribution models so that you can have an insight into how each one analyzes the importance of your marketing channels.
Final words
On the bottom line, analyzing your business progress is exceptionally crucial yet difficult. And the case gets even more complex in the online world. Thus, analytic tools help you to keep an eye on the performance of your website.
Google Analytics is an efficient provenly tool that enables you to track, gather, analyze, and evaluate your website’s performance through various reports. We have mentioned different attributes of google analytics, along with a detailed procedure to create and operate the google analytics account under this ultimate guide. Thus read and implement the above-discussed information accordingly to rest assured of systematic use.
Best of luck


